Animals slaughtered in the Netherlands
I take a look at how many animals are slaughtered in the Netherlands.
In this post I take a look at how many animals are slaughtered in the Netherlands. The goal is to find and clean the data to answer this question and to get a better grasp of exactly how many animals are killed here every hear. It’s both an exercise in data cleaning and calibrating one’s beliefs about this topic. It’s a topic that’s easy easy to avoid thinking about, while probably being one of the most important things you should think about.
Data
The data on the number of animals slaughtered in the Netherlands can be found on StatLine. This is a database managed by CBS, the national statistical office of the Netherlands. Specifically, we’re going to take a look at the meat production numbers (vleesproductie). These numbers can be found in a table here. We can adapt what is in the table by changing various filters. By default it shows both the number of animals and the weight of the animals. I’m only interested in the number of animals, so I deselect the weight-related rows. I also see that they offer data on more dates than is shown by default, so I select all of the dates. I then download the data as a .csv file using the button in the top right corner. Now we can start cleaning the data for our purposes.
Setup
Run the following setup code if you want to follow along. You can download the data yourself or use my file.
Note that we have to use read_csv2() because the data values are
separated by a semi-colon. This is an annoying default in the
Netherlands (and probably elsewhere in Europe).
Data cleaning
Let’s begin by inspecting the first few rows of the data.
# A tibble: 6 x 3
  Slachtdieren     Perioden      `Aantal slachtingen (x 1 000)`
  <chr>            <chr>                                  <dbl>
1 Rundvee (totaal) 1990 januari                            194.
2 Rundvee (totaal) 1990 februari                           160.
3 Rundvee (totaal) 1990 maart                              190.
4 Rundvee (totaal) 1990 april                              174.
5 Rundvee (totaal) 1990 mei                                201.
6 Rundvee (totaal) 1990 juni                               172.
It should be no surprise, but the data is in Dutch. Let’s translate the
data, starting with the columns. One of the columns is called
Aantal slachtingen (x 1 000), which means number of slaughtered
animals in units of 1000. Instead of translating this directly, I will
simply rename it to count and multiply the values by 1000.
Let’s clean up the period column next. It seems like it contains the
year and the month (in Dutch). I can translate the month names to Dutch,
but I first want to make sure that all data values are structured the
same way. count() is a great function to inspect that.
# A tibble: 6 x 2
  period            n
  <chr>         <int>
1 1990             17
2 1990 april       17
3 1990 augustus    17
4 1990 december    17
5 1990 februari    17
6 1990 januari     17
Curiously, not all rows in the data contain both the year and the month. Some only have the year. This is important because that means we can’t just sum the number of slaughtered animals per year because that means we’ll actually get twice the number of animals because we’ll sum both the animals slaughtered in that year and each month of that year.
Let’s also inspect the bottom few rows.
# A tibble: 6 x 2
  period             n
  <chr>          <int>
1 2022 april*       17
2 2022 februari*    17
3 2022 januari*     17
4 2022 juni*        17
5 2022 maart*       17
6 2022 mei*         17
The last several months have an asterisk in the month name. This asterisk indicates that the data for these months has not yet been finalized.
What I want to do next is create a new column that only contains the
year and another column that contains the month. Creating the year
column is easy because we can use parse_number() to extract the year
from the data. The month is a bit trickier, but we can use a regular
expression to remove the year, leaving us with the month. We use
str_remove() and tell it to remove a string pattern that consists of 4
numbers and a space. We can also use it to remove the asterisk from the
more recent months, but first we add a column to say whether the numbers
are final or not based on this asterisk. After doing that, we recode the
month values that need to be translated and also convert the empty
string to a missing value. Finally, we remove the period column
because we don’t need it anymore.
Next are the animals. Let’s take a look at the unique values we have.
# A tibble: 17 x 2
   animal                                   n
   <chr>                                <int>
 1 Eenhoevigen                            422
 2 Geiten (totaal)                        422
 3 Kalkoenen                              422
 4 Kalveren jonger dan 9 maanden          422
 5 Kalveren van 9 tot en met 12 maanden   422
 6 Koeien                                 422
 7 Overig pluimvee                        422
 8 Overige kippen                         422
 9 Rundvee (totaal)                       422
10 Schapen incl. lammeren                 422
11 Schapenlammeren                        422
12 Stieren                                422
13 Totaal kalveren                        422
14 Totaal volwassen runderen              422
15 Vaarzen                                422
16 Varkens (totaal)                       422
17 Vleeskuikens                           422
Hmm… it looks like there are a few challenges here. First, we seem to have both total values and non-total values, so we should take care to separate these. Second, we need to figure out what each word means. Even my Dutch is not helping me in understanding each type of animal.
Let’s first simply translate the values so we get a better grasp of what we are dealing with. The translations won’t be direct translations. Instead, I’ll already think about what kind of categories make sense and how I want to plot the data later, so I translate the values into names that will also be useful later.
Translating the words was very helpful to better understand the data. One thing that’s clear is that some of the values are totals of other values. Below I list which values in the data are actually sums of other values:
- adult cattle: Total of cows, heifers, and bulls
- cattle: Total of adult cattle and calves
- calves: Total of calves (< 9 months) and calves (9-12 months)
If we are interested in what the totals are made of, we can remove the total columns and reconstruct them later if we want to. This works for the first two total columns, but not calves because they only started making the distinction between young and older calves in 2009. So let’s instead remove the values that the total values are made of and only keep the total values.
This leaves us with the following animals.
# A tibble: 9 x 2
  animal                        n
  <chr>                     <int>
1 broilers                    422
2 cattle                      422
3 chicken (mostly layers)     422
4 goats                       422
5 pigs                        422
6 poultry (misc)              422
7 sheep                       422
8 turkeys                     422
9 ungulates (mostly horses)   422
This looks fine to me, which means we are almost done with the data
cleaning. At this point I want to create two separate data frames: one
that only contains the annual data and one that contains the monthly
data. This is easy to do because we can take all the annual data by
simply selecting the rows with a missing value in the month column.
And since the month column is useless in that data frame, we remove
it.
As a final step we can combine the year and month columns from the
monthly data frame into a single column, which will be useful for
plotting the data later. This requires a special function from the zoo
package (as.yearmon())
Data analysis
With the data cleaned up we can start to ask some questions. Let’s begin with a graph that shows as much of the data as possible. That means plotting the monthly data for each animal.
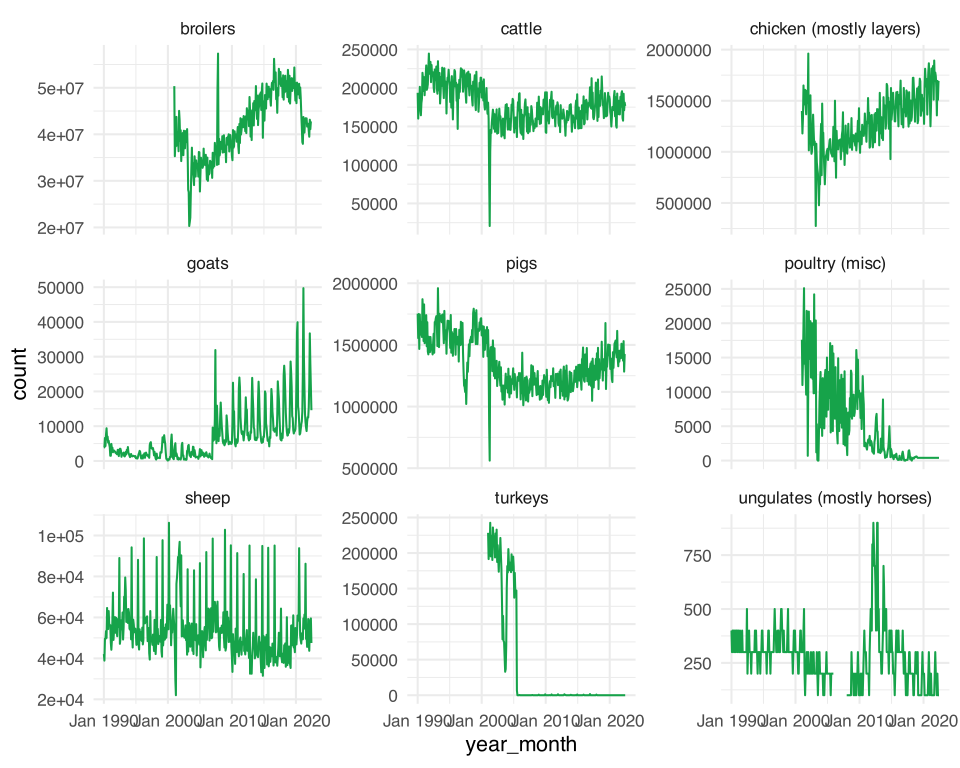
The monthly numbers seem to fluctuate quite a bit, so let’s plot annual data instead.
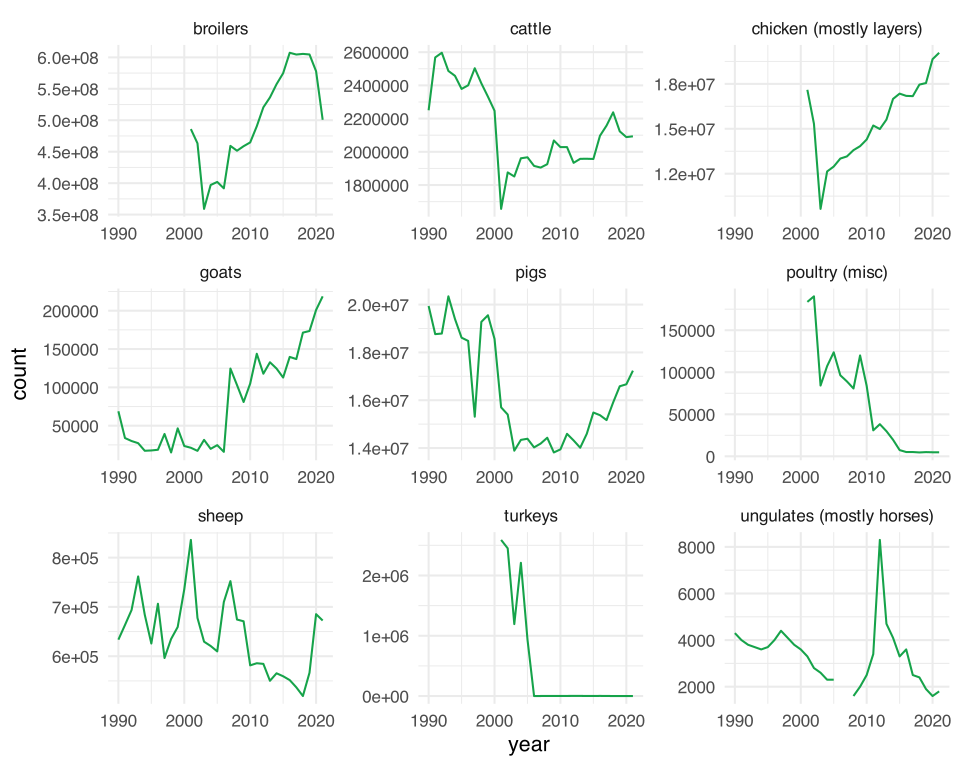
That’s clearer.
The first thing that jumps out to me is that some of the numbers are very high. In fact, they’re so high that ggplot has switched to the scientific notation to represent the numbers.
I also see an increase in the number of animals slaughtered for some of the animal groups, such as goats and non-broiler chickens. There has also been a steady increase in the number of slaughtered broiler chickens over the years, although it has decreased somewhat in the last several years. I don’t know why that is.
There are several other animal groups that have had worse years, like cattle and pigs. We see a huge drop around the year 2000, caused by the outbreak of foot-and-mouth disease and subsequent regulation. The numbers have been increasing again since, which I figured was the case, but I did not know that there was a time when even more of these animals were being slaughtered.
Let’s hone in on some exact numbers. Below we create a table to show the number of slaughtered animals in 2021, per animal.
# A tibble: 9 x 2
  animal                        count
  <chr>                         <dbl>
1 broilers                  500732500
2 chicken (mostly layers)    20079200
3 pigs                       17236800
4 cattle                      2093300
5 sheep                        672400
6 goats                        218700
7 poultry (misc)                 4800
8 ungulates (mostly horses)      1800
9 turkeys                           0
Oof. That’s over 500 million chickens! For reference, the Netherlands had a population of 17.17 million people in 2021.
How many animals were slaughtered in total, in 2021?
Apparently a total of 541039500, or 17.16 animals per second. That’s a bit of a bummer to end on, but then, this post was never going to have a happy ending.